How to generate des criptive statistics
如何生成描述性统计
1. Now you might now want to calculate some descriptive statistics for „Value‟ for Loyalty customers. Go to the top menu, click Tools->Data Analysis.
现在,现在你可能要计算一些描述性统计“值”为忠诚客户。转到顶部菜单中,单击“工具” - >“。
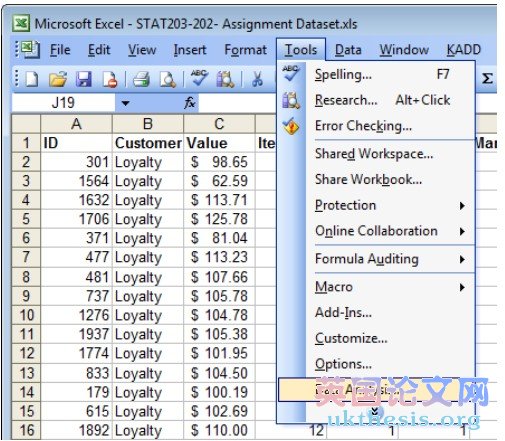
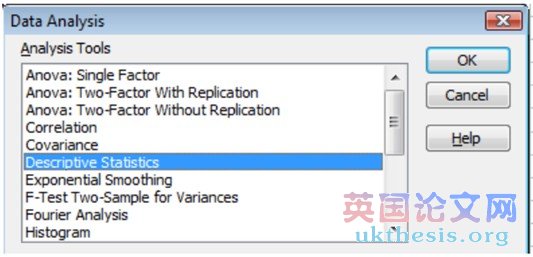
2. Select „Descriptive Statistics‟ then click OK.
选择“描述统计”,然后单击“确定”。
Now:
现在:
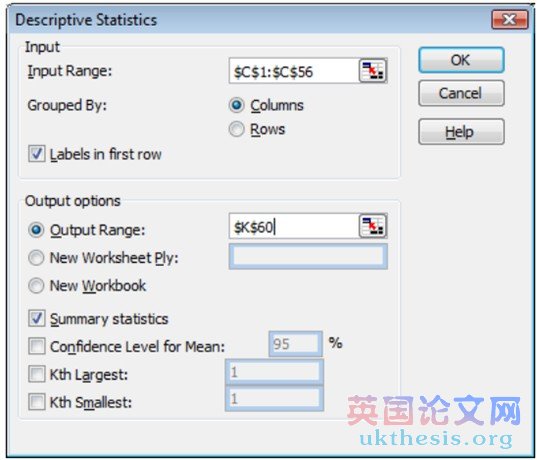
• • Click the white box next to „Input Range‟. Then select cell C1 and press Ctrl-Shift-Down to select the entire column
点击白框旁边的“输入范围”。然后选择单元格C1,按Ctrl-Shift-下选择整列
• •Check the box „Labels in first row‟
检查框“标签的第一行”
http://ukthesis.org/thesis_sample
• • For output range, you can select the cell where you want to output to go. For this example, we want the output to go to K60.
对于输出范围,您可以选择单元格中要输出去。在这个例子中,我们想输出到K60。
• •Check the box „Summary Statistics‟
检查“摘要统计”
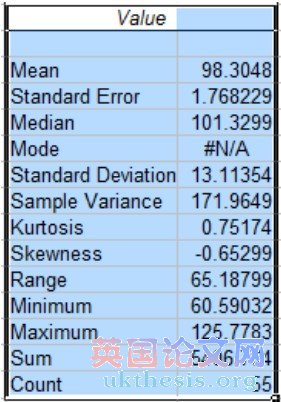
Now Excel will output the descriptive statistics beginning from cell K60:
现在,Excel将开始从细胞K60输出的描述性统计:
(责任编辑:www.ukthesis.com) |